Developed a focus gradient for separation and purification
Jo-Ann M. Jablonski, Thomas E. Wheat and Diane M. Diehl;
Waters Corporation, Milford, MA, US
introduction
Chromatographic separation methods and analytical separation methods for separation and purification are subject to the same physical and chemical principles. However, in preparative testing, scientists typically separate compounds on large columns and under high quality loads and require higher resolution to improve the purity and recovery of the collected components. Although designing a gentler gradient is a better preferred method to improve resolution, changing the gradient slope of the entire separation process can result in increased peak width and increased total run time. The focus gradient, which can replace the ordinary slower gradient, only reduces the gradient slope for the portion of the chromatogram where the resolution is required to be increased, so that the resolution of the peak close to the elution time can be increased without increasing the total run time. The focus gradient can be defined according to the search run or directly from the first preparation run.
experiment method
Gradient development step
â– Determine the system size of the preparation scale
â– Run search gradients
â– Design focus gradient
â– Run a focus gradient on the preparative column
Test conditions
instrument
Liquid Chromatography System: Waters Model 2525 Binary Gradient Module, Model 2767 Sample Management System, System Flow Path Organizer, Model 2996 Photodiode Array Detector,
AutoPurificationTM Flow Cell
Column: XBridgeTM Preparative OBDTM C18 Column 19 x 50 mm, 5μm (Cat. No. 186002977)
Flow rate: 25mL/min
Mobile phase A: 0.1% aqueous formic acid
Mobile phase B: 0.1% formic acid-acetonitrile solution
Wavelength: 260 nm
Sample mixture
Sulfonamide: 10 mg/mL
Sulfathiazole: 10 mg/mL
Sulfamethazine: 20 mg/mL*
Sulfamethadiazole: 10 mg/mL
Sulfamethoxazole: 10 mg/mL
Sulfamethoxazole: 4 mg/mL
Total concentration: 64 mg/mL (dissolved in dimethyl sulfoxide)
*Selected peaks for focusing gradients
Results and discussion
Determine the size of the system at the preparation scale
â– Remove the column and replace it with a two-way.
â– Mobile phase A uses acetonitrile and mobile phase B uses acetonitrile containing 0.05 mg/mL uracil (solving non-additive mixing and viscous problems).
â– Monitoring at 254 nm.
â– Collect baseline data for 100% A for 5 minutes.
â– At 5.01 minutes, set the gradient to 100% B and collect additional 5 minutes of data.
â– Determine the difference in absorbance between 100% A and 100% B.
â– Calculate the time when there is a 50% difference in absorbance.
â– Calculate the time difference between the start of the step (5.01 minutes) and the 50% time point.
â– Multiply the time difference by the flow rate.

The system volume is defined as the volume from the gradient forming point to the front of the column. The system volume is used for the design of the focus gradient. As shown in Figure 1, the system volume in the instrument configuration used in this test is 3.0 mL.

Design focus gradient
step 1
The solvent concentration of the elution peak No. 3 at 2.47 minutes was formed at an earlier time point. As shown in Figure 3, the offset between the detector and the gradient forming point is equal to the system volume plus the column volume. The offset used for this particular system is equal to the previously determined 3 mL system volume plus the volume of the 19 x 50 mm preparative column (11.9 mL), which is 14.9 mL. At a flow rate of 25 mL/min, it takes 0.59 minutes for the solvent concentration to reach the detector. The 2.47 minute elution time minus the 0.59 minute offset time is equal to 1.88 minutes. Since the initial large scale gradient had a retention time of 0.39 minutes, the time to form the percent acetonitrile of the elution peak was 1.88 minutes minus 0.39 minutes, ie 1.49 minutes.

Step 2
The percentage of acetonitrile eluting the peak at 2.47 minutes was calculated. The original large scale gradient eluted 5-50% B in 5 minutes with an initial gradient residence time of 0.39 minutes.
The percentage of acetonitrile calculated from the gradient eluting the peak at 2.47 minutes was 13.4%, but since the gradient started at 5% acetonitrile, the actual concentration of acetonitrile eluting the peak was 13.4% + 5%, or 18.4% acetonitrile. .
Step 3
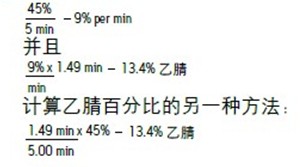
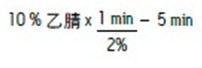
The focus gradient of the chromatographic peaks intended to separate the elution time in the middle of the gradient should begin with the original small scale test conditions, typically 0-5% B. Immediately after the start of the injection, the gradient was rapidly increased to a percentage of acetonitrile which was 5% lower than the expected acetonitrile percentage concentration of the elutable target peak. The gentle focus gradient portion continues under the 1/5 slope used in the search gradient. A five-fold slower gradient is expected to provide higher resolution for chromatographic peaks with close elution times. The focused gradient fraction of 5% of the expected acetonitrile concentration above the elutable target peak was terminated. The original gradient eluted 5-50% B in 5 minutes, or 45% in 5 minutes. Thus, the acetonitrile concentration varies by 9% per minute (simplified from about 9% to 10%). Then, the new gradient slope should be 1/5 of 10%, or 2% change per minute. The 10% change in acetonitrile concentration was achieved by a 2% change per minute, indicating that the focused gradient time segment used to separate peaks 3 and 4 should last for 5 minutes. Once the focused portion of the gradient is complete, the acetonitrile percentage is rapidly increased to 95% B to clean the column. After equilibrating the column, the gradient under the initial conditions is terminated. 5-45% B = 9% per minute (rounded to 10% per minute) The gradient slope varies by 2% per minute.
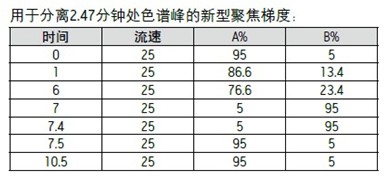
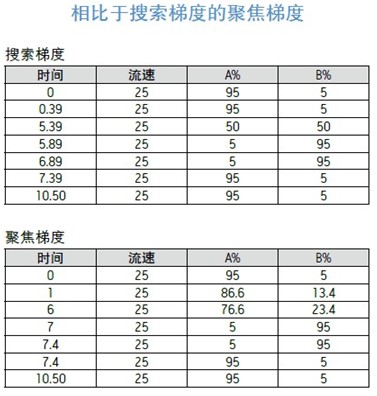
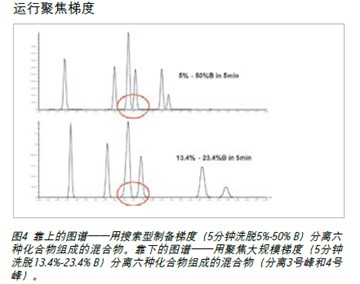
The focus gradient significantly increases the resolution of peaks 3 and 4 in the chromatogram shown in Figure 4. Peaks 5 and 6 are shifted by the gradient focusing portion, and the gradient portion continues to elute the compound at a slower slope until a higher percentage of acetonitrile set for column cleaning enters the column. The slower focus gradient provides higher resolution of the naturally mixed components without increasing run time, thus enabling chromatographic analysts to obtain purer products and better recovery.
in conclusion
When scientists perform product purification for subsequent experiments, they need to separate the compounds under high quality loading. The focus gradient improves the separation of the elution time close to the chromatographic peak without increasing the run time, thereby improving the separation. System volume information can be directly optimized for preparative gradients. The use of a focus gradient increases product yield and purity without increasing solvent consumption and waste generation. The focus gradient method allows separation and thus helps control the cost of purification.
About Waters Corporation ( )
For more than 50 years, Waters Corporation (NYSE: WAT) has made significant advances in medical services, environmental management, food safety and global water quality monitoring by providing practical and sustainable innovations that have created business for laboratory-related organizations. Advantage.
As a pioneer in a range of separation science, laboratory information management, mass spectrometry and thermal analysis technologies, Waters technology's breakthroughs and laboratory solutions create a lasting platform for customer success. With $1.64 billion in revenue and 5,400 employees in 2010, Waters will continue to lead customers around the world to explore science and achieve excellence.
N95 Cup Mask Production Equipment and Supporting Equipment
Kn95 Cup Facemask Machine,Kn95 Cup Mask Machine,Kn95 Cup Respirator Machine,Kn95 Fold Flat 3D Mask Machine
Ningbo Dokee Mask Machine Co., Ltd. , https://www.autrendsmac.com